

Because our future starts today
Sustainability at ERGO
Insurance is a long-term business, which is why we at ERGO always have the future in mind. We operate responsibly, are committed to environmental and climate protection, create a good working atmosphere for our employees and are committed to helping others. Look ahead with us and find out what ERGO is doing for sustainability.
Detailed information on sustainability at ERGO
This may interest you as well


Always up to date!
Follow us on social media
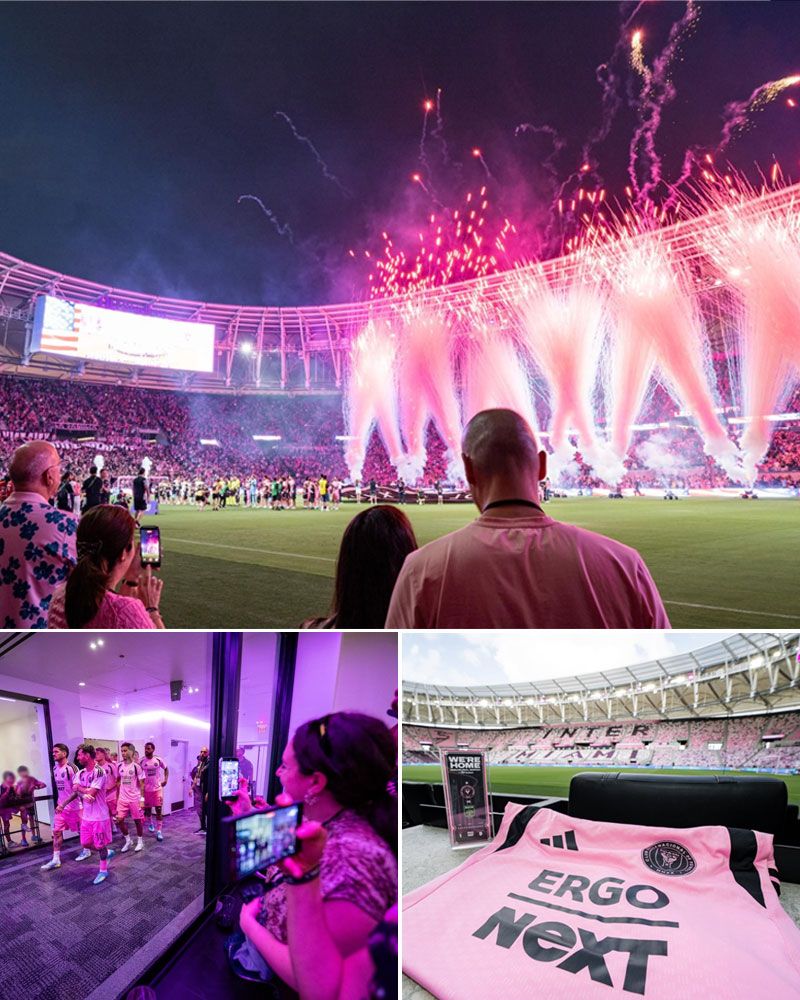
What an unforgettable night in Miami! 🌴⚽
The grand opening of Inter Miami CF’s new home, Nu Stadium, and the first home match of the season at the venue created an incredible atmosphere on and off the pitch.
#TeamERGO and ERGO Next Insurance were thrilled to be there on site, celebrating this milestone together with the club, the fans and partners. Together, we cheered Inter Miami CF on and shared in the excitement of this very special night.
During the evening, ERGO colleagues also met with club owners David Beckham as well as Jorge and José Mas. The evening included a meet & greet with star player Sergio Reguilón. [...]
#InterMiamiCF #Partnership #StadiumOpening #NuStadium ERGO Group AG
9.4.2026
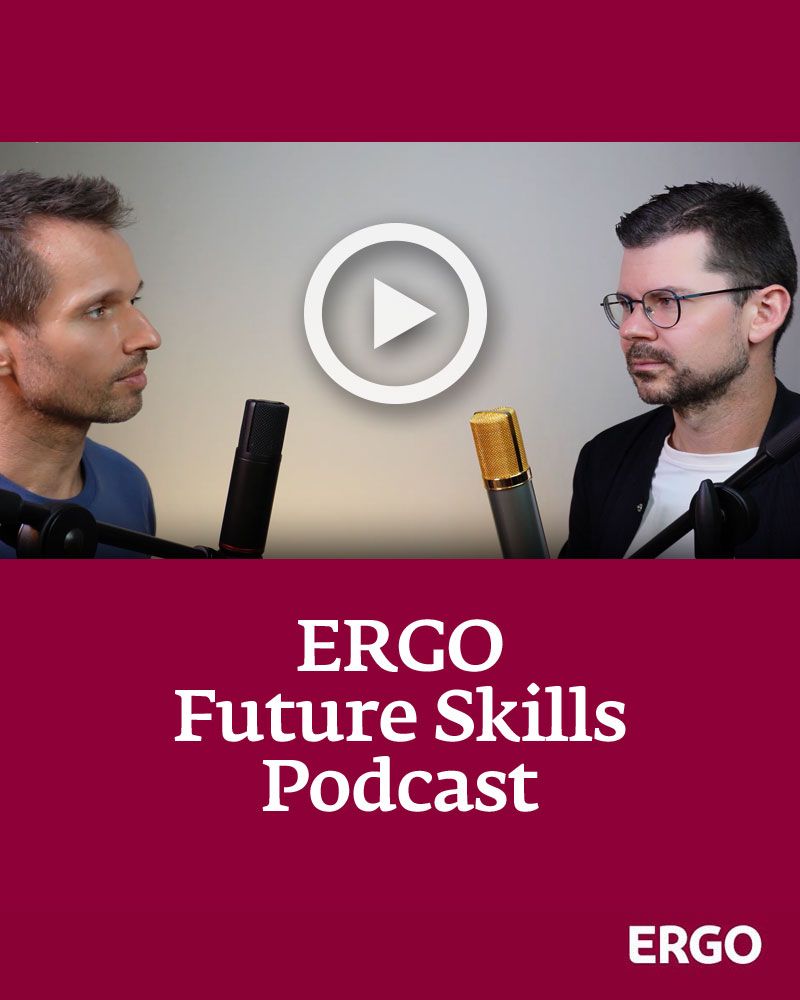
AI isn’t a vending machine. So why do we use it like one? We prompt, we wait, we copy-paste the answer – and call it “working with AI”.
But what happens, if we start treating AI less like a tool and more like a team member?
In the latest episode of the ERGO Future Skills Podcast, Dr. Arndt Pechstein and Dr. Martin Schwemmle explore how real collaboration between humans and AI can work – beyond quick fixes and one-shot prompts.
[...]
ERGO Group AG8.4.2026
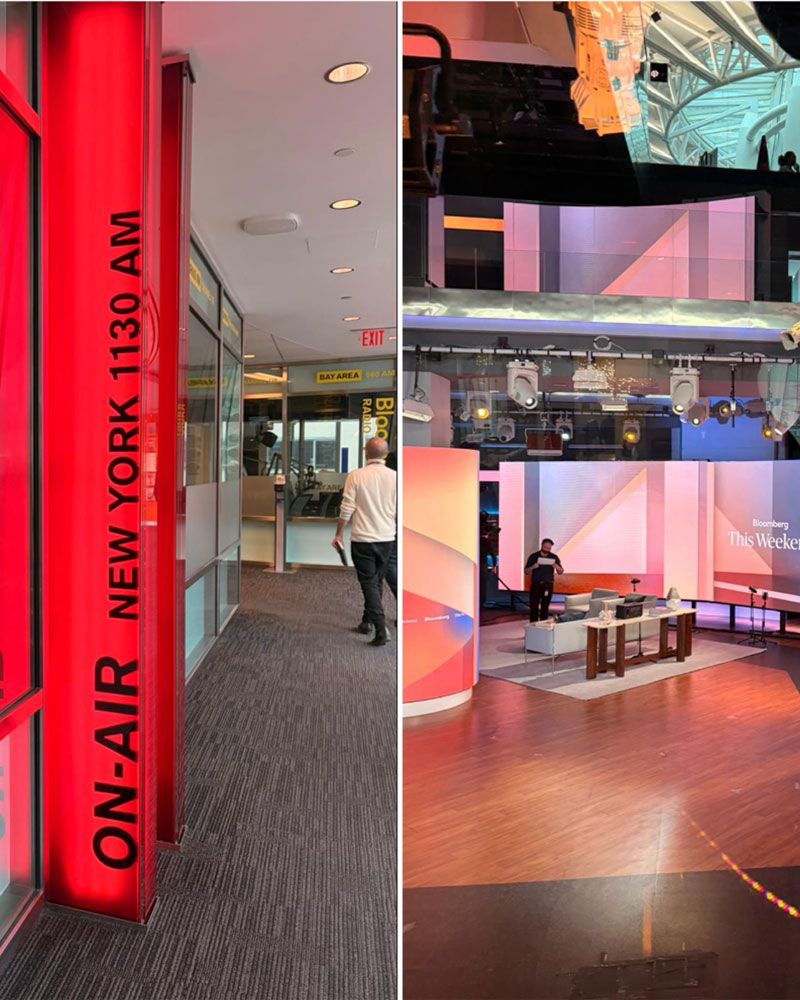
Back from New York.
Together with ERGO Next Insurance, our colleagues from ERGO had their first engagement with leading U.S. media outlets – a great opportunity to talk about our entry into the U.S. market and the vision behind ERGO Next.
👉 What makes it particularly exciting for ERGO as a Group:
We are bringing together one of the most successful turnaround stories of the past decade with one of the most ambitious and forward-looking insurance projects out there.
A big thank you to the colleagues who made this outreach possible – and especially to Yannick Tetzlaff for driving this forward.
ERGO Group AG7.4.2026