

Weil unsere Zukunft heute beginnt
Nachhaltigkeit bei ERGO
Versicherung ist ein langfristiges Geschäft, deshalb haben wir bei ERGO die Zukunft immer im Blick. Wir wirtschaften verantwortungsbewusst und integrieren Nachhaltigkeitsaspekte in unserem Geschäftsbetrieb, in unseren Produkten und bei der Kapitalanlage. Schauen Sie mit uns nach vorne und erfahren Sie, wie ERGO Nachhaltigkeitsaspekte in den verschiedenen Handlungsfeldern berücksichtigt.
Unsere Handlungsfelder
Weitere Informationen


Immer aktuell informiert!
Folgen Sie uns auf Social Media
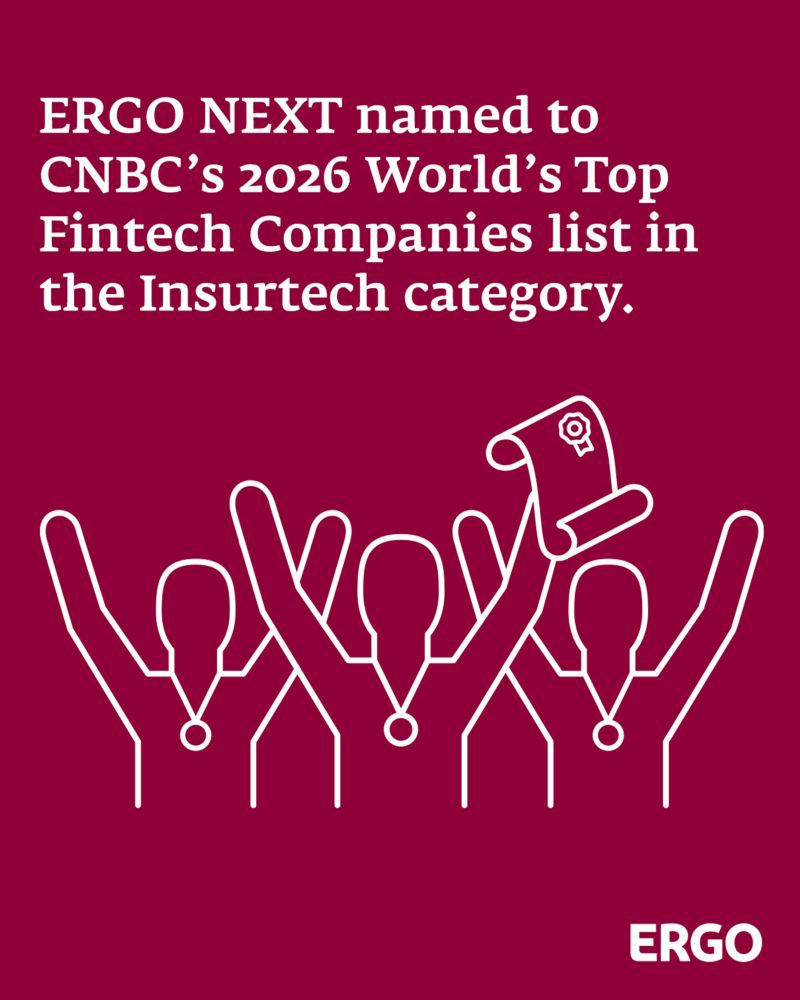
Congratulations to our colleagues at ERGO NEXT Insurance for this outstanding achievement! 🎉
👉 https://lnkd.in/eiWHcbqN
w/ Effi Fuks Leichtag | Matt Crawford
#InsurTech #Fintech ERGO Group AG
23.7.2026
The most valuable knowledge in an organisation rarely lives in a handbook.
A significant share of business‑critical expertise is still neither formally documented nor systematically accessible. Instead, it is embedded in people, routines, and situational decisions – the so‑called tribal knowledge.
Demographic change, among other factors, means that more and more of this knowledge is leaving organisations. According to figures from the German Insurance Association (GDV Gesamtverband der Deutschen Versicherungswirtschaft e.V., German only), in Germany a full quarter of those employed in the insurance sector belong to the baby boomer generation.[...]
ERGO Group AG23.7.2026
Krankenversicherungen im Chip Digitaltest: DKV ist erneut Spitzenreiter!
In der neuesten Untersuchung der Chip-Redaktion zur Digitalisierung in der Krankenversicherung hat die DKV Deutsche Krankenversicherung AG erneut eine herausragende Platzierung erzielt.
Mit einer Bestnote von 1,0 verteidigt sie die Spitzenposition zum vierten Mal in Folge. In allen vier Teilkategorien – App, Webportal, digitale Gesundheitsangebote und Service – wurde die DKV mit der vollen Punktzahl ausgezeichnet.[...]
ERGO Group AG20.7.2026