

Weil unsere Zukunft heute beginnt
Nachhaltigkeit bei ERGO
Versicherung ist ein langfristiges Geschäft, deshalb haben wir bei ERGO die Zukunft immer im Blick. Wir wirtschaften verantwortungsbewusst und integrieren Nachhaltigkeitsaspekte in unserem Geschäftsbetrieb, in unseren Produkten und bei der Kapitalanlage. Schauen Sie mit uns nach vorne und erfahren Sie, wie ERGO Nachhaltigkeitsaspekte in den verschiedenen Handlungsfeldern berücksichtigt.
Unsere Handlungsfelder
Weitere Informationen


Immer aktuell informiert!
Folgen Sie uns auf Social Media
"If your AI never leaves the pilot phase, it’s not innovation – it’s a very expensive slide deck.”
At ERGO, AI is not a side project. It’s systematical and comprehensive implementation throughout the organisation is one of the key pillars of our transformation – as Mark Klein, our Chief Digital Officer, puts it.
On the Main Stage at GITEX EUROPE in Berlin, Mark discussed with Alok Jha, Science and Technology Editor at The Economist, what this looks like in practice:[...]
 ERGO Group AG
1.7.2026
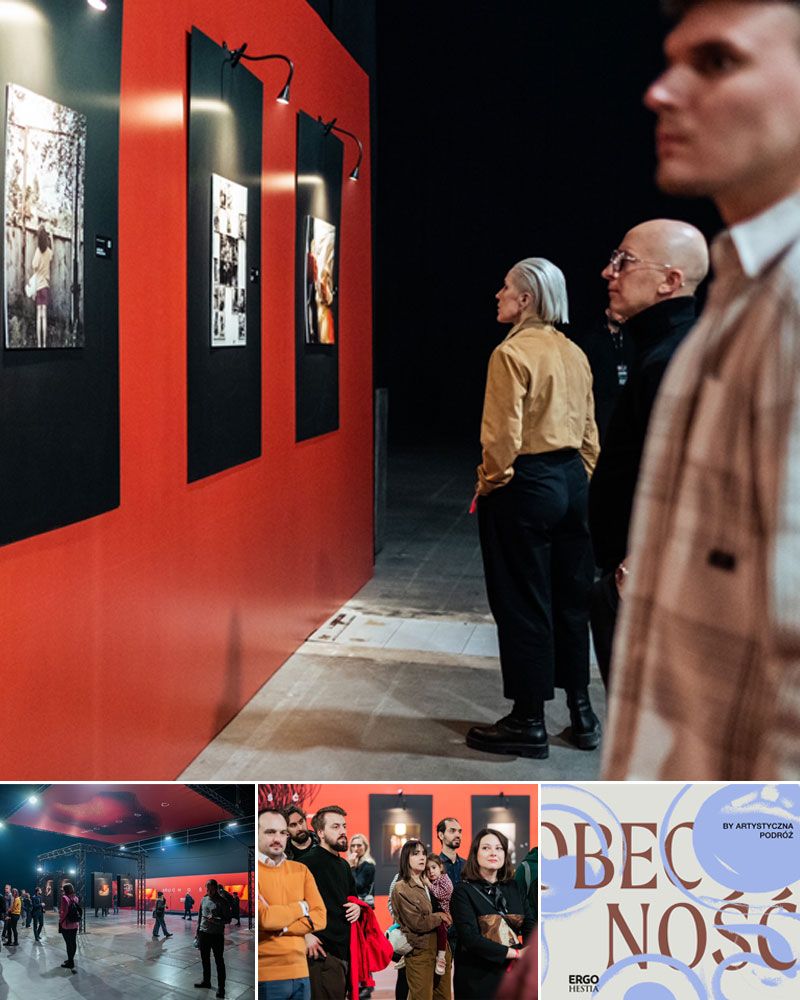
What if one idea could take you all the way to New York?🏢📸
Our colleagues at ERGO Hestia are always proud to spotlight initiatives driven by their company – like the Fundacja Artystyczna Podróż Hestii contest (Artistic Journey). It’s a bold invitation for young artists to turn a spark of creativity into something real.And yes – the rewards are as good as they sound:
🛩️ a trip to New York (with some serious pocket money on the side)
📲 the latest iPhone Pro (512 GB)
🖼️ a final exhibition during @Inside Seaside – one of the largest indoor
festivals in Poland[...]
ERGO Group AG30.6.2026
German Brand Award 2026 – and the ERGO Customer Portal is on the winners’ list for the fourth consecutive year! 🏆
“Solving customer requests on the spot” – that is what the ERGO customer portal stands for as a digital game-changer in Germany, and it is precisely what has now been recognised in the “Digital Solutions & Apps” category.Why the jury was convinced:
✔️ “Instant journeys” as a benchmark: from registration via video identification to reimbursing a dental cleaning in real time – all in just a few digital steps, in one seamless process[...]
ERGO Group AG29.6.2026